

Excel Copilot: From Messy Project Plan to Professional Dashboard & Summary
Can Excel Copilot actually manage a project? The answer is yes—but only if you know how to talk to it.
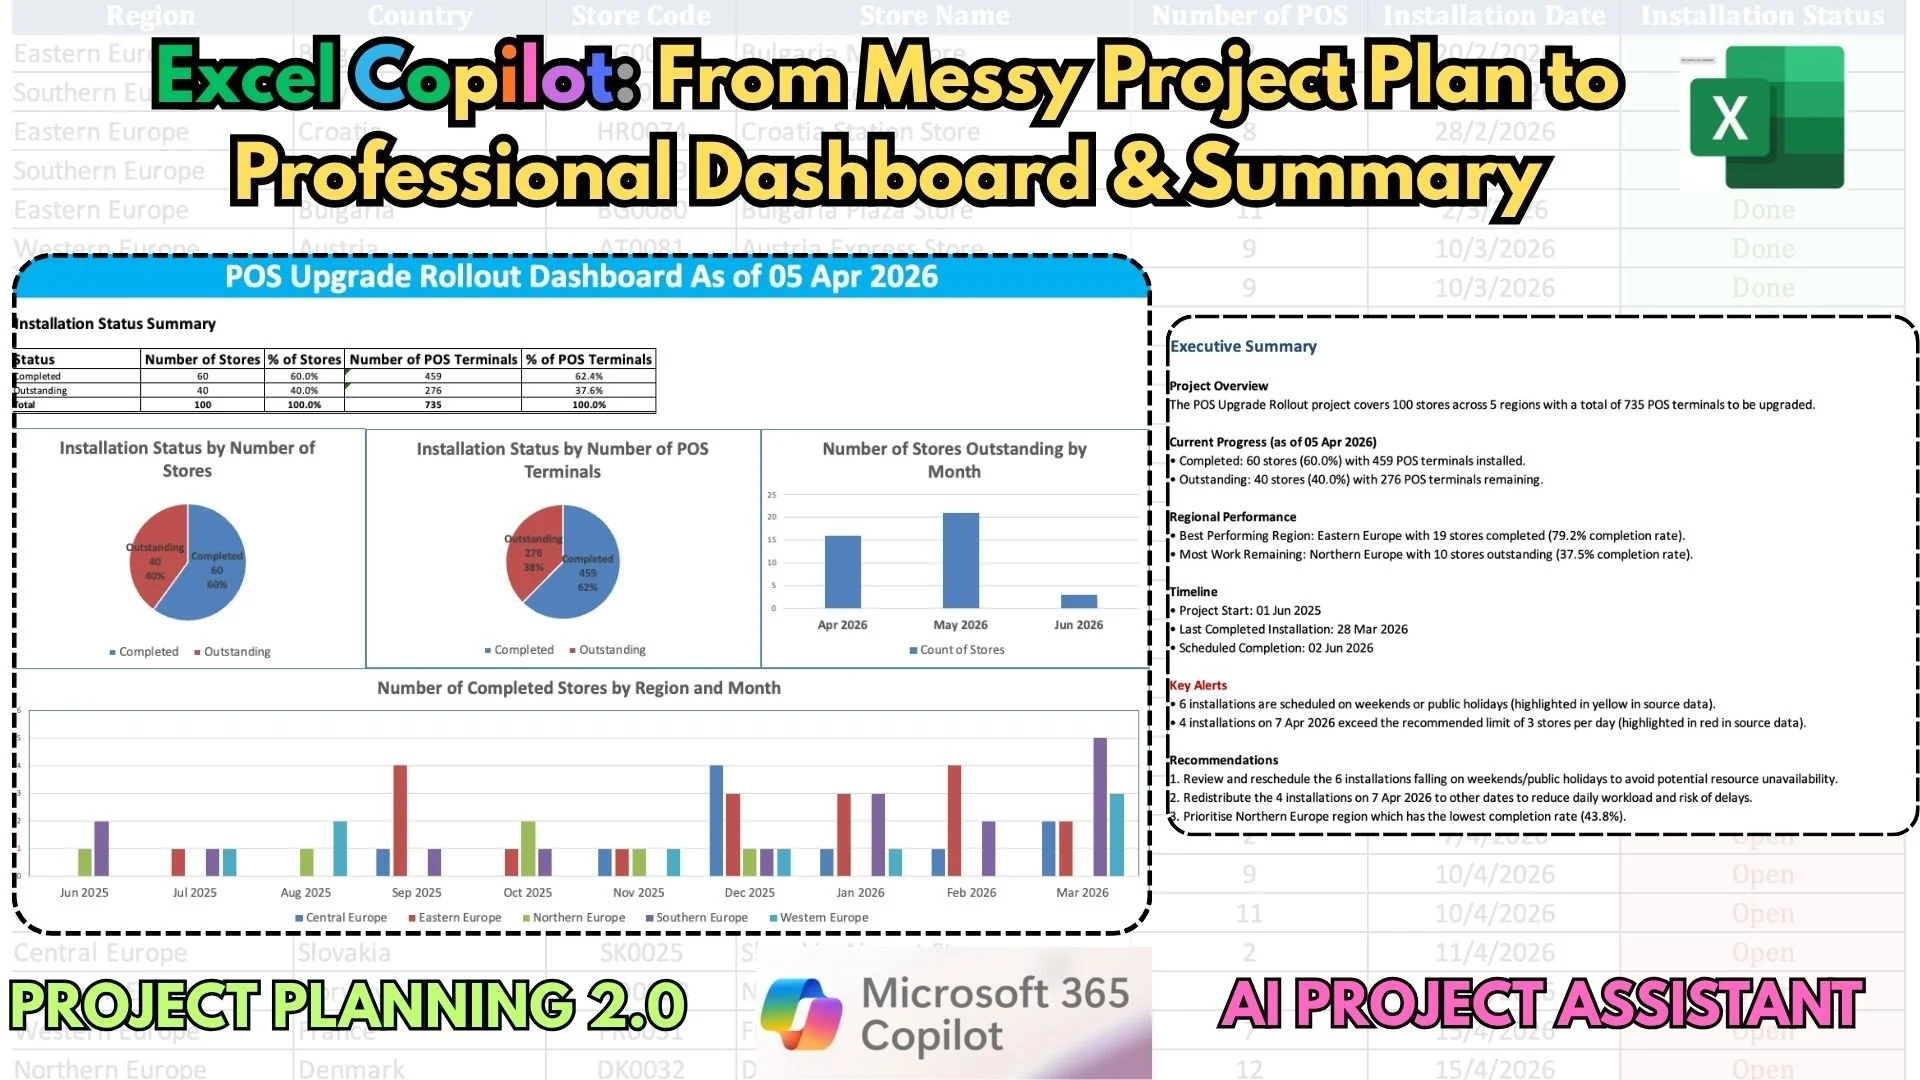
In this video, I’m moving past the "one-click miracle" hype to show you the real-world workflow of an AI Project Assistant. We take a messy POS hardware rollout plan and transform it into a boardroom-ready Executive Dashboard and Summary.
What you’ll learn in this tutorial:
- Data Auditing: How to use Copilot to catch scheduling errors like weekends and public holidays.
- Resource Planning: Setting capacity limits and having AI flag over-allocated dates in red.
- The "Iterative" Prompting Method: Why simple prompts fail and how to use detailed requirements to get accurate charts on the first pass.
- Executive Visualization: Moving from raw data tables to high-impact regional breakdowns and KPI gauges.
- The Final Polish: Building a dynamic, professional dashboard tab and generating a precise text-based Executive Summary in seconds.
The Reality Check: If you’ve struggled with data inaccuracies or "hallucinations" in Copilot, this video is for you. I’ll show you my "Trust but Verify" method using manual pivot tables to ensure your AI-generated reports are 100% accurate before they hit your boss's inbox.
This workflow isn't just for rollout plans—you can apply these exact techniques to system testing, issue log analysis, or any data-heavy project management task.
If you found this deep dive helpful, please Like and Subscribe for more Microsoft Copilot strategies for professionals!
#ExcelCopilot #MicrosoftCopilot #ProjectManagement #ExcelTutorial #AIDashboard #ProjectPlanning #ExecutiveSummary #Office365 #AIatWork #DataVisualization